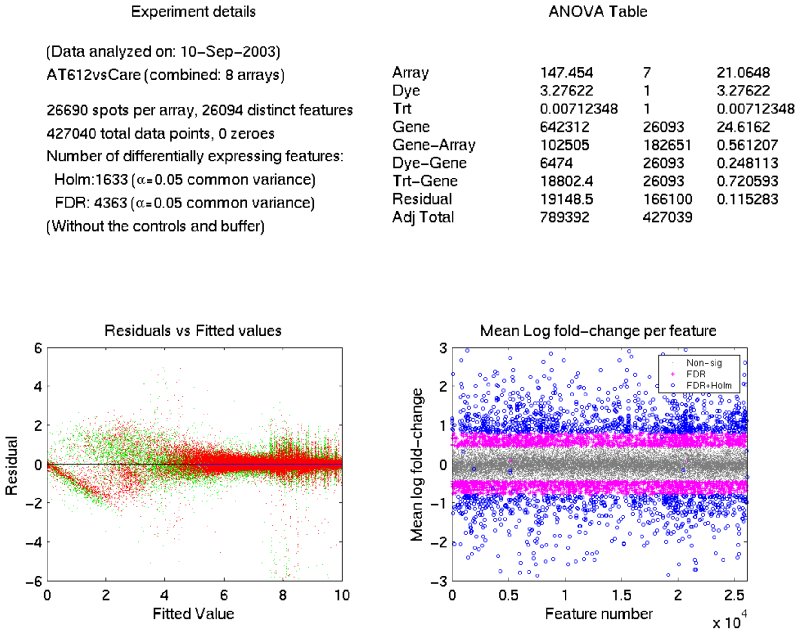
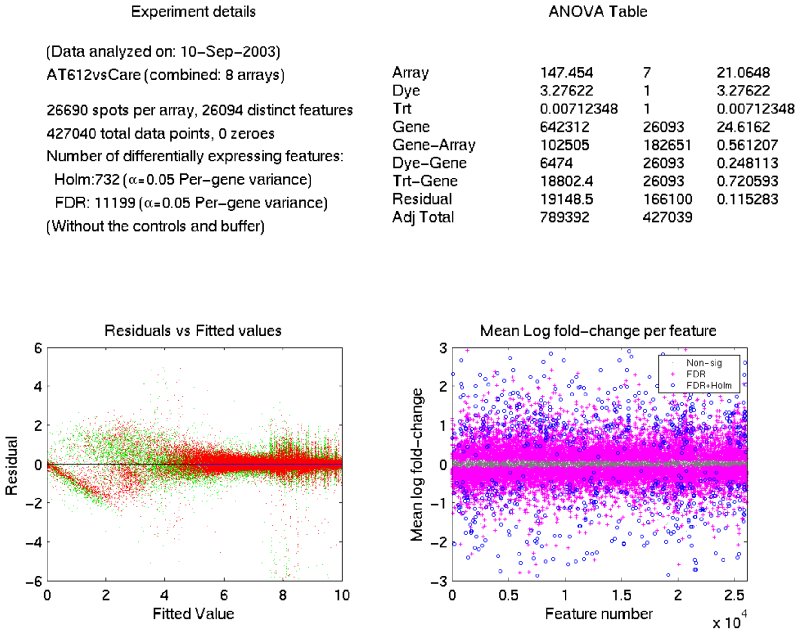
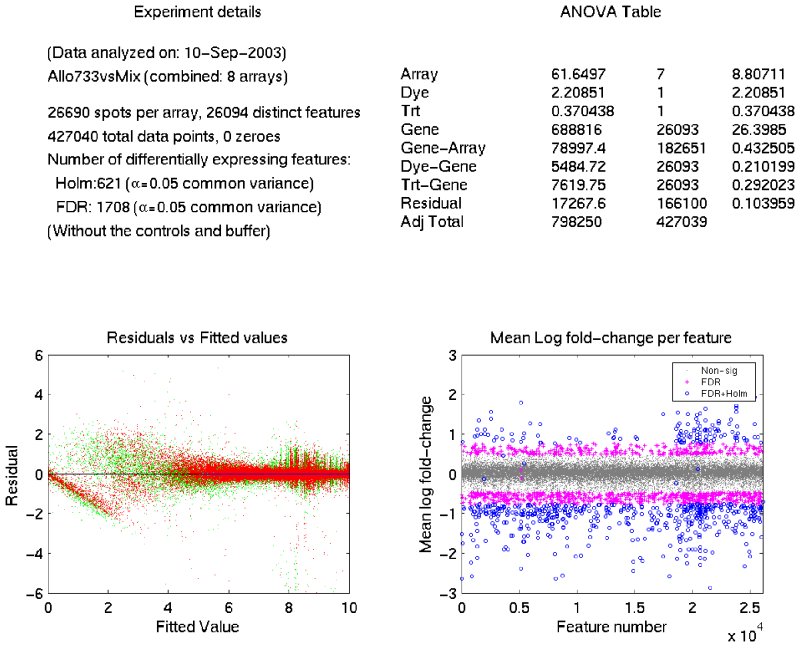
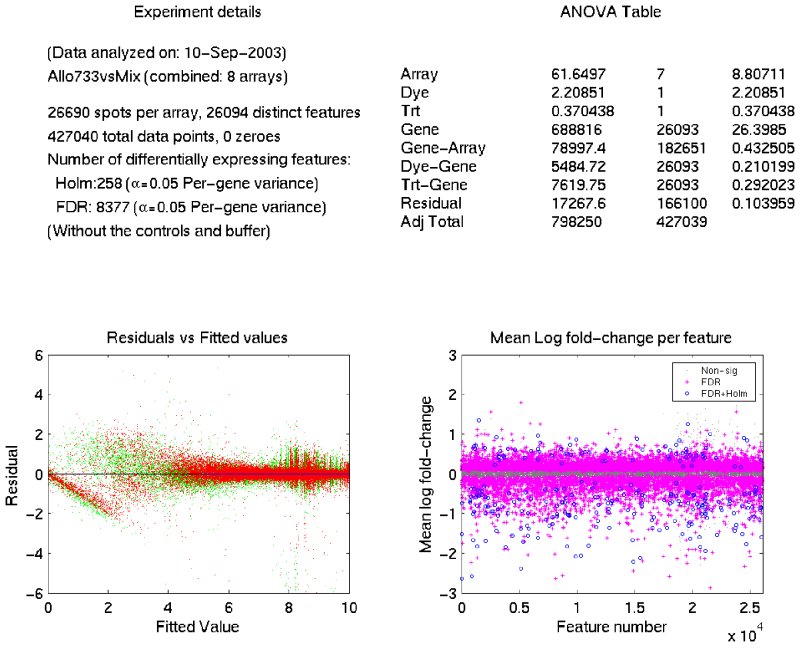
table S1. Microarray data analysis using a linear model. Each experiment consisted of four dye-swaps and eight slides as described in the Methods and shown below. The analyzed data can be viewed in a “scatter plot” or “text”.
| Experiment 1 |
At4 vs. Aa (leaves) |
Common Variance |
Per-gene Variance |
Shared Gene List (Text) |
| Experiment 2 |
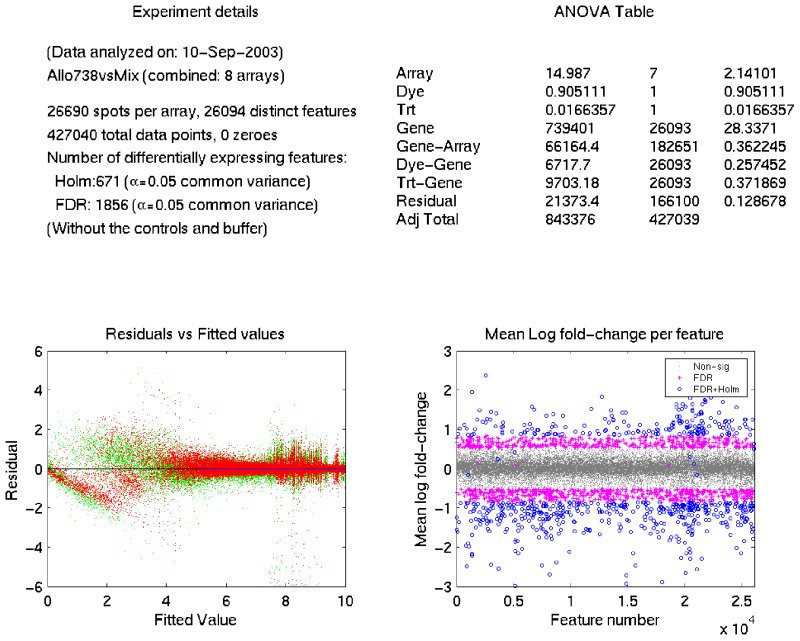
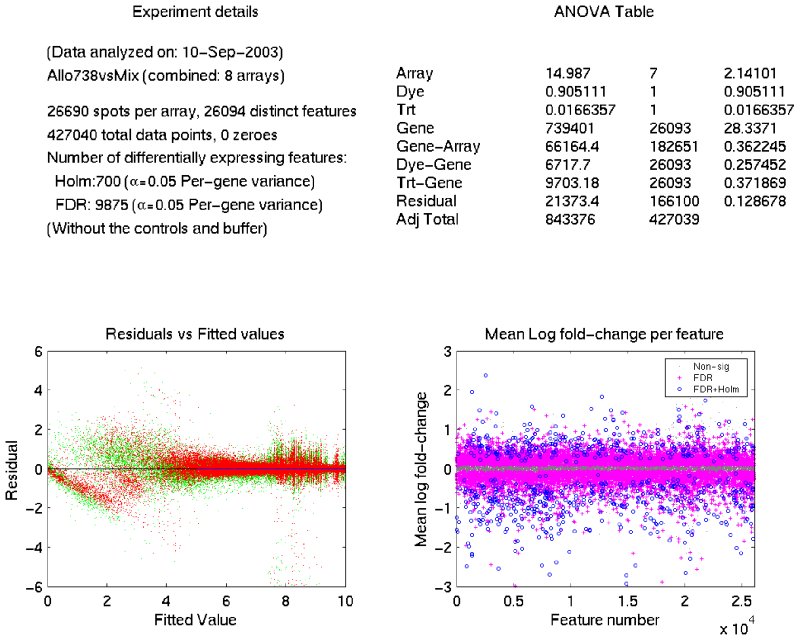
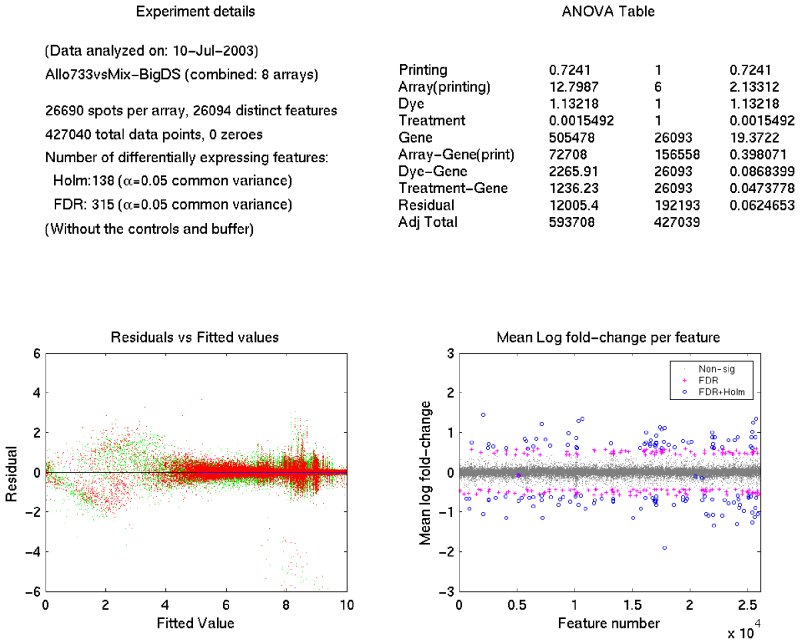
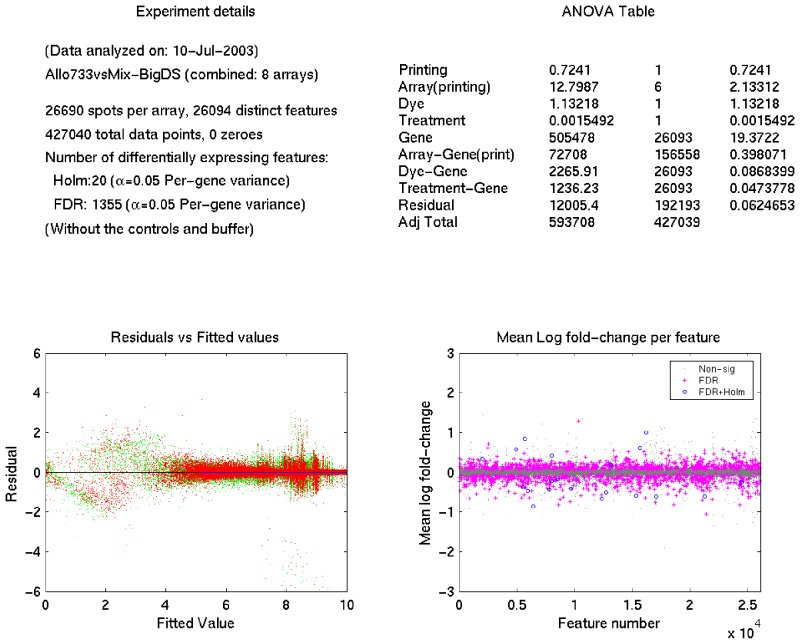
Allo733 vs. PM (leaves) |
Common Variance |
Per-gene Variance |
Shared Gene List (Text) |
| Experiment 3 |
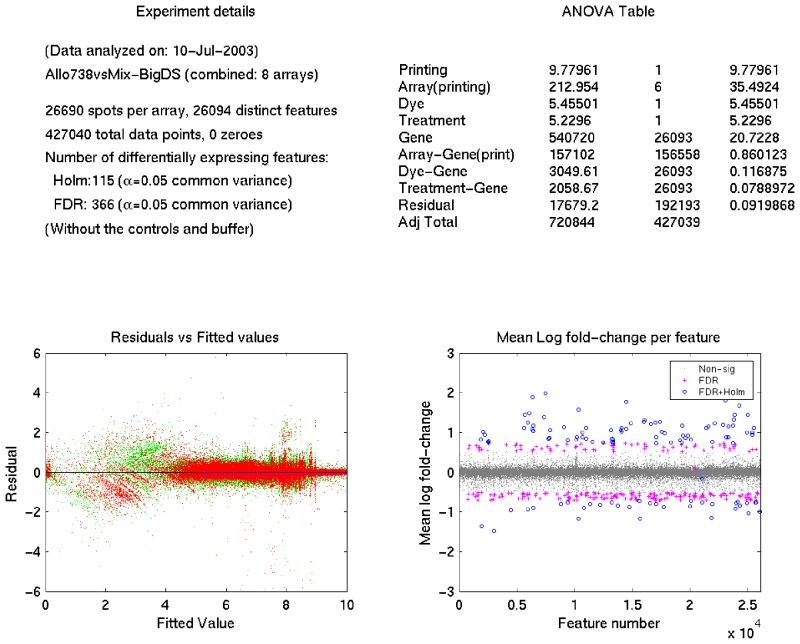
Allo738 vs. PM (leaves) |
Common Variance |
Per-gene Variance |
Shared Gene List (Text) |
| Experiment 4 |
Allo733 vs. PM (flower buds) |
Common Variance |
Per-gene Variance |
Shared Gene List (Text) |
| Experiment 5 |
Allo738 vs. PM (flower buds) |
Common Variance |
Per-gene Variance |
Shared Gene List (Text) |
| Experiment 6 |
At2 vs. At4 (leaves) |
Common Variance |
Per-gene Variance |
Shared Gene List (Text) |
2. The microarray data were generated using procedures provided by MIAME (http://www.mged.org/Workgroups/MIAME/miame.html). The data were obtained from five experiments as shown below. The detailed procedures for microarray and experimental design, slide printing, hybridization, targets (cDNA probes), data collection, and analysis were described in a previous paper 19. The data can be down-loaded for re-analysis or verification of data analysis using other statistical packages or commercial software in addition to the linear model used in this study.
3. Raw data (spot quantitation matrix) were generated using a GenePix 4000B scanner and GenePix Pro4.1 software (Axon Instruments). The data obtained from each slide will be displayed after clicking the slide number.
4. The raw data (hybridization intensities obtained in Cy3 and Cy5 channels) were converted using the logarithm function and subjected to analysis of variance (ANOVA) as described in the Methods section. No additional step of data processing was used.
table S2. Microarray experimental design
table S2a. Microarray analysis of gene expression in leaves between two parents, A. thaliana (At4) and A. arenosa (Aa).
| Slide No. |
Leaf RNA |
Cy3 |
Cy5 |
Printing Pattern |
Dye-swap |
| 1 |
RNA1 |
At4 |
Aa |
1 |
1 |
| 2 |
RNA1 |
Aa |
At4 |
1 |
1 |
| 3 |
RNA1 |
At4 |
Aa |
2 |
2 |
| 4 |
RNA1 |
Aa |
At4 |
2 |
2 |
| 5 |
RNA2 |
At4 |
Aa |
1 |
3 |
| 6 |
RNA2 |
Aa |
At4 |
1 |
3 |
| 7 |
RNA2 |
At4 |
Aa |
2 |
4 |
| 8 |
RNA2 |
Aa |
At4 |
2 |
4 |
table S2b. Microarray analysis of gene expression in leaves between Allo733 and parental mix.
| Slide No. |
Leaf RNA |
Cy3 |
Cy5 |
Printing Pattern |
Dye-swap |
| 9 |
RNA1 |
Allo733 |
PM |
1 |
1 |
| 10 |
RNA1 |
PM |
Allo733 |
1 |
1 |
| 11 |
RNA1 |
Allo733 |
PM |
2 |
2 |
| 12 |
RNA1 |
PM |
Allo733 |
2 |
2 |
| 13 |
RNA2 |
Allo733 |
PM |
1 |
3 |
| 14 |
RNA2 |
PM |
Allo733 |
1 |
3 |
| 15 |
RNA2 |
Allo733 |
PM |
2 |
4 |
| 16 |
RNA2 |
PM |
Allo733 |
2 |
4 |
table S2c. Microarray analysis of gene expression in leaves between Allo738 and parental mix.
| Slide No. |
Leaf RNA |
Cy3 |
Cy5 |
Printing Pattern |
Dye-swap |
| 17 |
RNA1 |
Allo738 |
PM |
1 |
1 |
| 18 |
RNA1 |
PM |
Allo738 |
1 |
1 |
| 19 |
RNA1 |
Allo738 |
PM |
2 |
2 |
| 20 |
RNA1 |
PM |
Allo738 |
2 |
2 |
| 21 |
RNA2 |
Allo738 |
PM |
1 |
3 |
| 22 |
RNA2 |
PM |
Allo738 |
1 |
3 |
| 23 |
RNA2 |
Allo738 |
PM |
2 |
4 |
| 24 |
RNA2 |
PM |
Allo738 |
2 |
4 |
table s2d. Microarray analysis of gene expression in flowers between Allo733 and parental mix.
| Slide No. |
Flower bud RNA |
Cy3 |
Cy5 |
Printing Pattern |
Dye-swap |
| 25 |
RNA1 |
Allo733 |
PM |
1 |
1 |
| 26 |
RNA1 |
PM |
Allo733 |
1 |
1 |
| 27 |
RNA1 |
Allo733 |
PM |
2 |
2 |
| 28 |
RNA1 |
PM |
Allo733 |
2 |
2 |
| 29 |
RNA2 |
Allo733 |
PM |
1 |
3 |
| 30 |
RNA2 |
PM |
Allo733 |
1 |
3 |
| 31 |
RNA2 |
Allo733 |
PM |
2 |
4 |
| 32 |
RNA2 |
PM |
Allo733 |
2 |
4 |
table S2e. Microarray analysis of gene expression in flowers between Allo738 and parental mix.
| Slide No. |
Flower bud RNA |
Cy3 |
Cy5 |
Printing Pattern |
Dye-swap |
| 33 |
RNA1 |
Allo738 |
PM |
1 |
1 |
| 34 |
RNA1 |
PM |
Allo738 |
1 |
1 |
| 35 |
RNA1 |
Allo738 |
PM |
2 |
2 |
| 36 |
RNA1 |
PM |
Allo738 |
2 |
2 |
| 37 |
RNA2 |
Allo738 |
PM |
1 |
3 |
| 38 |
RNA2 |
PM |
Allo738 |
1 |
3 |
| 39 |
RNA2 |
Allo738 |
PM |
2 |
4 |
| 40 |
RNA2 |
PM |
Allo738 |
2 |
4 |
table S2f. Microarray analysis of gene expression in leaves between A. thaliana diploid (At2) and autotetraploid (At4).
|
Slide No. |
Flower bud RNA |
Cy3 |
Cy5 |
Printing Pattern |
Dye-swap |
|
41 |
RNA1 |
At2 |
At4 |
1 |
1 |
|
42 |
RNA1 |
At4 |
At2 |
1 |
1 |
|
43 |
RNA1 |
At2 |
At4 |
2 |
2 |
|
44 |
RNA1 |
At4 |
At2 |
2 |
2 |
|
45 |
RNA2 |
At2 |
At4 |
1 |
3 |
|
46 |
RNA2 |
At4 |
At2 |
1 |
3 |
|
47 |
RNA2 |
At2 |
At4 |
2 |
4 |
|
48 |
RNA2 |
At4 |
At2 |
2 |
4 |
table S3. RT-PCR analysis of candidate genes detected by microarray analysis.
| Locus |
TAIR description |
Symbol |
RNA (UW) |
RNA (TAMU) |
Ratio (At4/Aa) |
Ratio (Allo733/Mix) |
Ratio (Allo738/Mix) |
RT-PCR fragment (bp) |
Primer sequences |
| AT5G56030 |
heat shock protein 81-2 (HSP81-2) |
HSP90 |
+ |
+ |
0.90406 |
-0.6977 |
-0.87724 |
499 |
F: 5'-TGTCTCTGCAACCAAGGAAGGTC-3’ R: 5'-ATCGGCTTCAACAACATCATCGT-3’ |
| AT5G12020 |
heat shock protein 17.6-II |
HSP17.6b |
+ |
- |
1.4619 |
-1.02 |
-1.8317 |
494 |
F: 5'-CCGAAGACCACAACAACGAGAAG-3’ R: 5'-CCTCACGCATTCCGATTACATTC-3’ |
| AT1G80840 |
WRKY family transcription factor |
WRKY40 |
+ |
+ |
1.9652 |
-2.5912 |
-2.4936 |
465 |
F: 5’-GAAGATCCACCGACAAGTGCTTT-3’ R: 5’-TTTGACAGAACAGCTTGGAGCAC-3’ |
| AT1G19610 |
plant defensin protein, putative (PDF1.4) |
PDF1.4 |
+ |
+ |
1.0466 |
-0.60814 |
-0.57314 |
360 |
F: 5’-CCTTTGCCTCTCCATCTTCCTTA-3’ R: 5’-TCAAAGAAAATTCCCAAAAACCAA-3’ |
| AT1G75830 |
plant defensin protein, putative (PDF1.1) |
PDF1.1 |
+ |
+ |
-2.1055 |
0.83476 |
0.90425 |
322 |
F: 5’-CGCTGCTCTTGTTTTCTTTGCT-3’ R: 5’-AAACAAAGCAACATAACATATCTGG-3’ |
| AT2G43590 |
glycosyl hydrolase family 19 (Chitinase) |
CHI |
+ |
+ |
n.s. |
0.7796 |
0.89841 |
471 |
F: 5’-CGTAACTACTGCCAGAGCAGCAA-3’ R: 5’-GAACACCGAGACCCGACATAAAG-3’ |
| AT3G15210 |
ethylene responsive element binding factor 4 (AtERF4) |
ATERF4 |
+ |
+ |
0.97404 |
-1.021 |
-1.079 |
433 |
F: 5’-GACCCACAATAATGCCAAGGA-3’ R: 5’-TACGTTACCGATCCCCATCAG-3’ |
| AT5G20230 |
blue copper binding protein |
BCB |
+ |
- |
2.7399 |
-3.1919 |
-2.2944 |
599 |
F: 5’-GAAAAGGGGGTGACCTGAGTTCT-3’ R: 5’-AGCGACCAGAAAAGTAGCACCAC-3’ |
| AT5G54190 |
NADPH:protochlorophyllide oxidoreductase |
PORA |
- |
- |
-0.9472 |
1.7914 |
0.78946 |
455 |
F: 5’-AAACCATTTGGGCCACTTTCTT-3’ R: 5’-CAAGTCTTTTCCCAGCCTCTGA |
| AT4G27440 |
protochlorophyllide reductase precursor |
PORB |
+ |
+ |
-1.2321 |
2.0486 |
2.189 |
433 |
F: 5’-ACCAAATCAAATCCGAACATGG-3’ R: 5’-GGCTCTTTAGCTGTCGGGAAAT-3’ |
| AT3G46970 |
starch phosphorylase, putative |
SPP |
+ |
+ |
n.s. |
1.0583 |
1.5007 |
499 |
F: 5’-GAAATTTGGGAGATAAGCGATGG-3’ R: 5’-ATAACCCCAAGCAGGCAGATTTA-3’ |
| At3G02380 |
CONSTANS-like 2 (COL2) |
COL2 |
+ |
+ |
0.77842 |
-0.71412 |
-0.73129 |
436 |
F: 5’-ACCACCTGTGATGCTCGAGTT-3’ R: 5’-CTCCTCCAAAGCTCCTCTGGT-3’ |
| AT5G10140 |
MADS box protein FLOWERING LOCUS F (FLF) |
FLC |
+ |
+ |
-0.6118 |
0.78811 |
0.55986 |
617 |
F: 5’-AAATTAGGGCACAAAGCCCTCTC-3’ R: 5’-GTAGTGGGAGAGTCACCGGAAGA-3’ |
| AT5G09810 |
Actin 2 |
Act2 |
+ |
+ |
n.s. |
n.s. |
n.s. |
656 |
F: 5'-CTCATGAAGATTCTCACTGAG-3’ R: 5'-ACAACAGATAGTTCAATTCCCA-3’ |
Note: “+” matched microarray data; “-” did not match microarray data; “n.s.”: not significant; P-values associated with each gene are omitted in this table but displayed in table S1; Ratios shown are logarithm-fold changes in microarray analysis