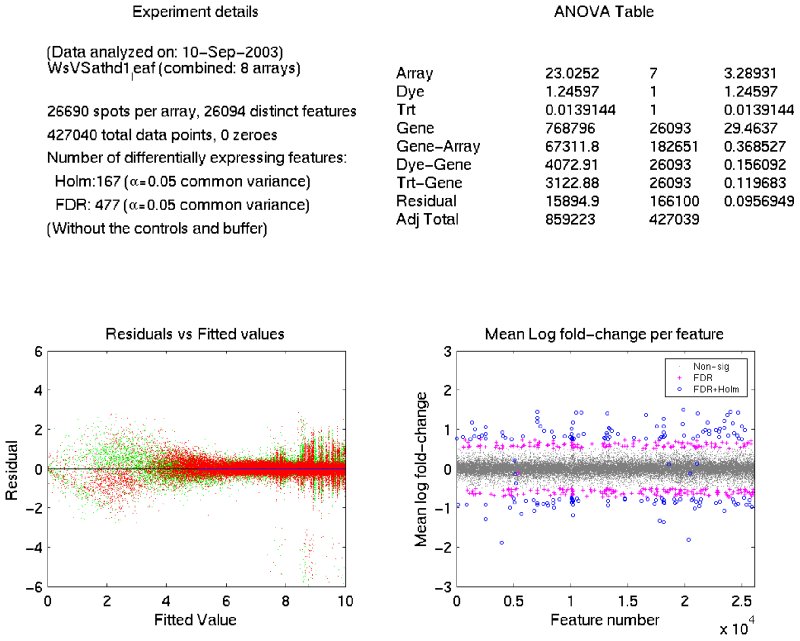
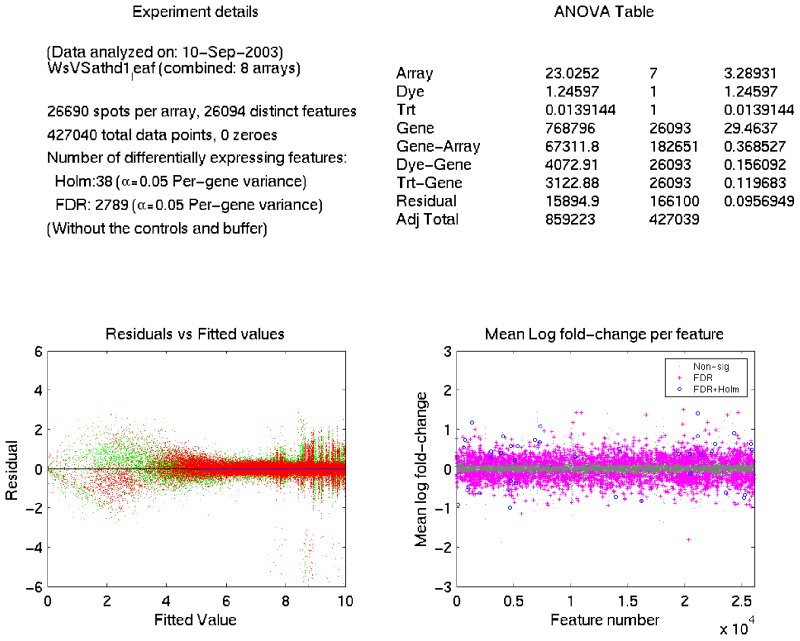
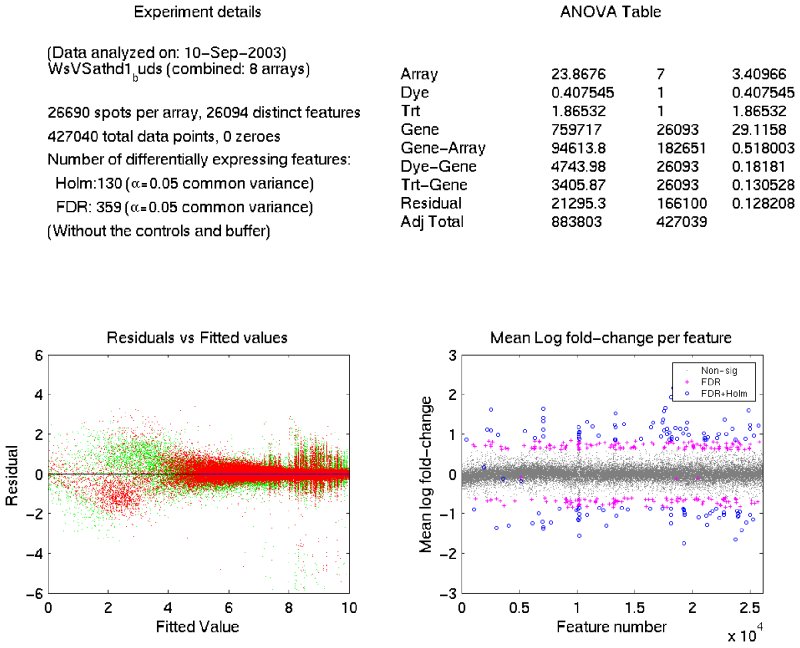
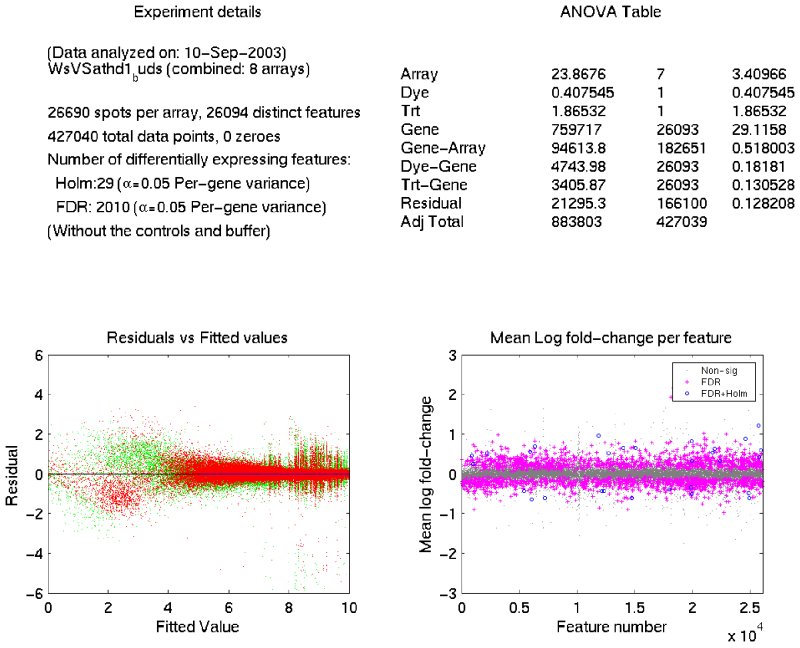
table S2. Microarray data analysis using a liner model 20 . Each experiment consisted of four dye-swaps and eight slides as described in the Methods and shown below. The analyzed data can be viewed in a scatter plot or text.
Experiment 1 |
Ws vs. athd1-t1 (leaves) |
Common Variance |
Per-gene Variance |
Experiment 2 |
Ws vs. athd1-t1 (flower buds) |
Common Variance |
Per-gene Variance |
Notes.
1. In each experiment, a text-delineated table of the significant genes detected is displayed. For example, in experiment 1 for the comparison of gene expression between Ws and athd1-t1 in leaves, the list included 477 and 2,789 genes whose expression levels varied significantly using common and per-gene variance, respectively. The list was tabulated using locus ID and logarithm-fold changes.
2. The microarray data were generated using procedures provided by MIAME ( http://www.mged.org/Workgroups/MIAME/miame.html ). The data were obtained from five experiments as shown below. The detailed procedures for microarray and experimental design, slide printing, hybridization, targets (cDNA probes), data collection, and analysis were described in a previous paper 18 . The data can be down-loaded for re-analysis or verification of data analysis using other statistical packages or commercial software in addition to the linear model used in this study.
3. Raw data (spot quantitation matrix) were generated using a GenePix 4000B scanner and GenePix Pro4.1 software (Axon Instruments). The data obtained from each slide will be displayed after clicking the slide number.
4. The raw data (hybridization intensities obtained in Cy3 and Cy5 channels) were converted using the logarithm function and subjected to analysis of variance (ANOVA) as described in the Methods section. No additional step of data processing was used.